
If you’ve ever looked at a BPMN 2.0 diagram and thought “this looks like a technical maze”, you’re not alone.
The truth is: BPMN 2.0 is not complicated. Poor explanations make it complicated.
This guide breaks it down the practical way, so you can read, understand, and actually use BPMN in real business processes, not just in theory.
What is BPMN 2.0?
BPMN 2.0 (Business Process Model and Notation) is a standardized way to visually map processes.
Think of it as:
A shared language between business and IT to describe how work actually happens.
It helps you:
- See inefficiencies
- Standardize processes
- Communicate clearly across teams
- Prepare for automation
Why BPMN Fails in Most Companies
Let’s address the real problem:
Most teams:
- Overcomplicate diagrams
- Use too many symbols
- Model everything instead of what matters
The result is a set of diagrams nobody understands or uses.
Rule #1:
You only need ~10–15 symbols to model 90% of business processes.
The Core BPMN 2.0 Symbols (That Actually Matter)
1. Events (Circles) – “Something Happens”
Events are represented by circles and define when something starts, interrupts, or ends a process.
They are critical because they define process boundaries and timing behavior.
Types you must know:
– Start Event (thin border) – Where Everything Begins
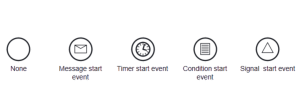
The Start Event defines what triggers the process. Without a clearly defined start, processes become ambiguous and inconsistent.
What it represents:
- A request
- A signal
- A specific condition
Example Scenario: Customer Support Request
A customer submits a support ticket through a website form. This action triggers the support workflow.
Practical insight:
Always ask: What exactly triggers this process? If different teams give different answers, your process is already misaligned.
– End Event (thick border)- Where the Process Finishes
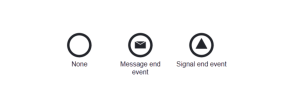
The End Event defines the final outcome of the process.
What it represents:
- A completed service
- A rejected request
- A delivered product
Example Scenario: E-commerce Order
The process ends when the product is delivered to the customer.
Practical insight:
A process can have multiple end events. Each one represents a different outcome — and should be measured separately.
– Intermediate Event (double border)- Something Happens During the Process
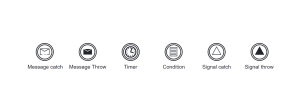
Intermediate Events represent something that happens between start and end, often outside direct control of the process.
They usually represent:
- Waiting
- Delays
- External inputs
- Time constraints
Example Scenario: Loan Approval
After submitting a loan application, the process pauses while waiting for a credit check from an external system.
Practical insight:
These are often hidden bottlenecks. In Lean Six Sigma, this is where you typically find delays and inefficiencies.
2. Activities (Rectangles) – “Work is Done”
This is where value is created.
Two main types:
– Task- The Smallest Unit of Work
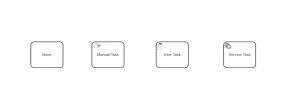
A Task is a single, atomic activity that cannot or should not be broken down further at the current level of detail.
What it represents:
- A manual action
- A system activity
- A decision execution (not the decision logic itself)
Example Scenario: Invoice Processing
- Validate invoice data
- Approve invoice
- Execute payment
Practical insight:
If a task contains multiple actions or decisions, it should probably be split or turned into a sub-process.
–Sub-process- Grouping Complexity
A Sub-Process is a collapsed activity that contains multiple steps within it.
Why it matters:
- Keeps diagrams clean
- Allows hierarchical modeling
- Enables different levels of detail for different audiences
Example Scenario: Employee Onboarding
Instead of showing 15 steps, you create a sub-process:
- Onboard Employee
- Contract signing
- IT setup
- Training sessions
Practical insight:
Use sub-processes when your diagram becomes too crowded or when stakeholders need different levels of abstraction.
3. Gateways (Diamonds) – “Decision Points”
This is where processes split.
The 3 you actually need:

– Exclusive Gateway (X) – OR (One path only)
This gateway represents a decision where only one path can be taken.
What it represents:
- Yes/No decisions
- Either/or conditions
Example Scenario: Expense Approval
If expense > $1000 → Manager approval
If expense ≤ $1000 → Automatic approval
Practical insight:
This is the most commonly used gateway and should be your default choice for decisions.
– Parallel Gateway (+) – AND (Multiple paths at once)
This gateway allows multiple paths to be executed simultaneously.
What it represents:
- Parallel work streams
- Independent activities
Example Scenario: Order Fulfillment
After order confirmation:
- Warehouse prepares items
- Finance generates invoice
Practical insight:
Parallelization is a key lever for reducing process cycle time.
– Inclusive Gateway (O) – OR (One or more paths)
This gateway allows one or multiple paths to be taken, depending on conditions.
Example Scenario: Marketing Campaign
- Send email to all customers
- Send SMS to premium customers
- Launch ads for selected segments
Practical insight:
Use sparingly — it adds complexity and can confuse stakeholders if overused.
4. Sequence Flow (Arrows) – “The Flow”
Arrows show the order of activities.
Simple rule:
If there are no arrows → there is no process.
5. Pools and Lanes – “Who Does What”
This is where BPMN becomes powerful.
– Pool
A Pool represents a major participant in the process.
What it represents:
- Organizations
- Systems
- External actors
Example Scenario: Insurance Claim
- Customer submits claim
- Insurance company processes claim
Practical insight:
Use pools to show interactions between independent entities.
– Lane
Lanes divide a pool into roles or departments.
What it represents:
- Functional areas
- Job roles
Example Scenario: Order Processing
- Sales receives order
- Finance approves payment
- Operations ships product
Practical insight:
Most delays occur at handoffs between lanes — this is where you should focus improvement efforts.
Example:
- Pool: Company
- Lanes: Sales / Finance / Operations
This is critical for:
- Identifying handoffs
- Finding delays
- Exposing inefficiencies
6. Message Flow (Dashed Arrow) – “Communication”
Used between different pools.
Example:
Customer ↔ Company
How to use BPMN in practice (Not just theory)
Here’s where most people fail. They learn symbols but don’t apply them properly.
Step 1: Start with a SIPOC mindset
Before drawing anything, define:
- Supplier
- Input
- Process
- Output
- Customer
This prevents messy diagrams.
Step 2: Map the Current State (AS-IS)
Focus on:
- What actually happens (not what should happen)
- Real delays and rework
- Actual decision points
Step 3: Identify Waste (Lean Thinking)
Look for:
- Waiting
- Rework
- Handoffs
- Bottlenecks
This is where BPMN connects directly to Lean Six Sigma.
Step 4: Design the Future State (TO-BE)
Now improve:
- Remove unnecessary steps
- Simplify decisions
- Reduce handoffs
Common mistakes to avoid
Let’s be direct:
Modeling everything
→ Focus on key processes
Using all BPMN symbols
→ You don’t need them
Ignoring business value
→ Diagrams must solve problems
No stakeholder validation
→ If people don’t recognize it, it’s wrong
When BPMN becomes powerful
BPMN is not just for diagrams.
It becomes powerful when you use it to:
- Standardize operations
- Train teams
- Support automation (RPA, workflows)
- Improve processes using DMAIC
Final Thought
BPMN 2.0 is not about drawing diagrams.
It’s about understanding how work flows and improving it systematically.
If you keep it simple and focused, it becomes one of the most practical tools in process improvement.
Want to go further?
If you’re serious about:
- Lean Six Sigma
- BPM and process optimization
- Real-world application (not theory)
Then learning how BPMN integrates with DMAIC and continuous improvement is the next step.
This is exactly the type of capability typically developed in structured Green Belt or BPM training: where you don’t just draw processes, you improve them with measurable impact.
Bottom line:
Start simple. Focus on value. Use BPMN as a tool, not an end goal.