
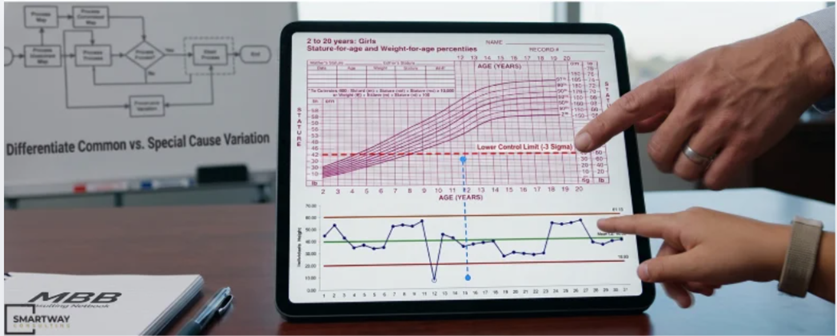
As a Lean Six Sigma Master Black Belt (MBB), I spend my life looking for patterns in data. I teach leaders and process specialists how to identify these patterns, interpret them, understand what their processes can actually deliver, and most importantly, how to avoid overreacting when a so-called “exception” happens.
But if you want to truly understand how to identify if a metric is a genuine exception, you don’t need a math degree. You just need to look at what a routine pediatrician visit can teach us about process improvement.
What a doctor’s visit taught me about corporate panic
A few years ago, I went to the doctor with my daughter. To my eye, she looked noticeably shorter than other kids her age. It was that classic, nagging parental worry. When I brought it up, the pediatrician initially gave me a very logical, common-sense answer: “Look at your height, and look at her dad’s height. Genetically, she was never going to be a basketball player. This is just how she’s built.”
In the Lean Six Sigma world, we call this Common Cause Variation. It’s the natural, expected “noise” built into any system. Given the genetic inputs, her height was fluctuating exactly within the normal, predictable boundaries of our family tree.
Nevertheless, the doctor humored me. She measured her, weighed her, and filled in the numbers into her computer. As the chart generated on the screen, her relaxed expression completely vanished. She murmured under her breath:
“Hmm… she is below -3 Sigma.”
That single phrase changed everything. It was the statistical trigger that prompted her to immediately order an extensive, deep-dive round of medical tests.
Fortunately, the results came back perfectly clean. She is simply naturally petite, healthy, and operating beautifully at her own baseline. But as an MBB, that moment stuck with me. The doctor’s instant pivot from “don’t worry, it’s just genetics” to “we need to investigate it” perfectly captures the exact discipline of Statistical Process Control (SPC) that we try to embed into corporate culture every single day.
What is the difference between Common Cause and Special Cause Variation?
To manage business operations effectively, leaders must know when to run tests and when to walk away. In both human biology and business operations, process variation is inevitable. No two days, no two products, and no two teams are identical. The real maturity of a leader is defined by knowing how to react to that variation.
Statistical Process Control (SPC) uses specific thresholds: Upper and Lower Control Limits (UCL and LCL), typically set at +3 and -3 Sigma from the mean, to take the emotion out of decision-making and clearly separate common cause vs. special cause variation.
Common Cause Variation (Inside the Control Limits)
- Definition: Common cause variation is the inherent, predictable, and natural randomness within a stable system.
- The Pediatrics Analogy: If my daughter’s height had mapped at -1.5 or -2 Sigma, the doctor would have sent us home with a smile. Why? Because while she would still be short, her growth would be stable and predictable for her baseline.
- The Business Impact: If a business process stays within these limits, you leave it alone. Tweaking a stable system based on routine ups and downs is what W. Edwards Deming called process tampering. It doesn’t fix anything; it just injects artificial chaos, increases operational costs, and frustrates your team. If the output within common cause limits is genuinely unsatisfactory, you don’t blame the people—you have to redesign the system architecture itself.
Special Cause Variation (Outside the Control Limits)
- Definition: Special cause variation is an unpredictable, erratic shift in a process caused by a specific, external factor outside the normal design of the system.
- The Pediatrics Analogy: Dropping below -3 Sigma is a statistically rare event. It meant a new, specific, and external variable might have entered the game, signaling that we needed an immediate look under the hood.
- The Business Impact: When an operational metric spikes wildly outside the control limits, you don’t shrug it off. You launch an immediate root-cause analysis to find out exactly what changed.
The two crucial mistakes leaders make in Process Improvement
As Lean Six Sigma Black Belts and Master Black Belts, we must enforce strict operational discipline in the boardroom to avoid two classic statistical errors:
| Operational Scenario | Statistical Reality | Correct Leadership Action | The Warning (Mistake to Avoid) |
| Data Fluctuates Within +/- 3 Sigma | System Capability: The process is stable and performing exactly as it was designed to do. | Let the stable process run. If the output is unsatisfactory, redesign the system architecture. | Type 1 Error (Tampering): Blaming the team or changing a local procedure for a normal fluctuation. This injects artificial variation and inflates the cost of poor quality. |
| Data Breaches Outside +/- 3 Sigma | Special Cause Assignment: A new, specific variable has entered the process. | Launch an immediate root-cause investigation to isolate the variable. | Type 2 Error (Ignoring a Signal): Rationalizing a major operational failure or a massive positive spike as “just a weird month,” missing the chance to mitigate risk or replicate a breakthrough. |
The Architecture of Organizational Capability
An organization cannot achieve this level of operational discipline if its people cannot read the signals. Moving past gut-feel management requires building specific analytical capabilities at every layer of the business.
In Lean Six Sigma architecture, this capability is divided into three distinct operational lenses:
-
The Foundational Lens: At the front line, teams must be able to identify waste and spot basic system noise, which is the core focus of Yellow Belt.
-
The Diagnostic Lens: To advanced-map workflows and systematically eliminate special cause variation, project leaders require the deeper statistical toolkit of a Green Belt.
-
The Strategic Lens: Finally, bridging the gap between data signals and corporate macro-strategy—knowing exactly when to redesign a stable system rather than tampering with it—is the domain of Black Belt.
How do you identify common cause vs special cause variation?
To identify the difference, use a Statistical Process Control (SPC) chart with control limits set at +/- 3 Sigma from the process mean. Common cause variation stays within these limits and represents the natural, predictable noise of a stable system. Special cause variation breaches these limits, indicating an external, specific variable has altered the process, requiring an immediate root-cause investigation.
The next time you look at your company’s monthly dashboards, ask yourself: Are we reacting to gut feelings, common sense, and minor fluctuations? Or do we actually know our Sigma thresholds?
True data-driven leadership means having the strategic discipline to let a stable process run, and the technical precision to mobilize your resources the exact second the system actually cries out for help.
Alexandra Niculae